|
Download Data (XLS File) |
|
|||||
|
|||||
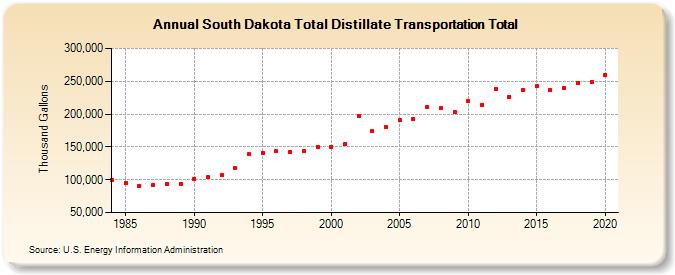
| South Dakota Total Distillate Transportation Total (Thousand Gallons) | |||||
| Decade | Year-0 | Year-1 | Year-2 | Year-3 | Year-4 | Year-5 | Year-6 | Year-7 | Year-8 | Year-9 |
|---|---|---|---|---|---|---|---|---|---|---|
| 1980's | 100,253 | 95,451 | 90,536 | 91,385 | 93,584 | 93,578 | ||||
| 1990's | 101,496 | 104,035 | 107,252 | 117,222 | 138,580 | 140,567 | 143,724 | 142,236 | 143,160 | 150,551 |
| 2000's | 150,570 | 153,926 | 196,448 | 174,130 | 180,522 | 190,758 | 192,871 | 211,179 | 208,737 | 202,962 |
| 2010's | 219,158 | 214,493 | 238,489 | 226,600 | 237,354 | 242,409 | 236,729 | 240,118 | 247,685 | 249,245 |
| 2020's | 259,559 |
| - = No Data Reported; -- = Not Applicable; NA = Not Available; W = Withheld to avoid disclosure of individual company data. |
| Release Date: 2/9/2022 |
| Next Release Date: Suspended |