|
Download Data (XLS File) |
|
|||||
|
|||||
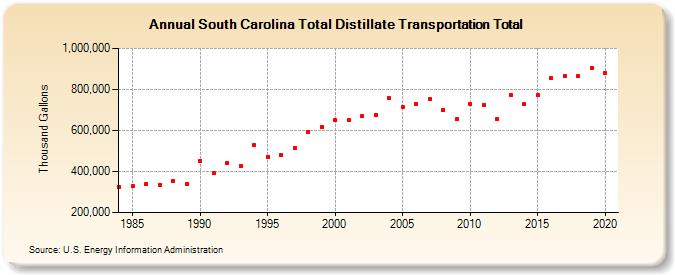
| South Carolina Total Distillate Transportation Total (Thousand Gallons) | |||||
| Decade | Year-0 | Year-1 | Year-2 | Year-3 | Year-4 | Year-5 | Year-6 | Year-7 | Year-8 | Year-9 |
|---|---|---|---|---|---|---|---|---|---|---|
| 1980's | 322,335 | 327,061 | 338,337 | 334,896 | 355,843 | 339,523 | ||||
| 1990's | 451,835 | 391,323 | 440,370 | 428,548 | 528,959 | 471,459 | 480,802 | 514,478 | 594,162 | 617,857 |
| 2000's | 648,658 | 651,417 | 668,336 | 674,894 | 756,846 | 712,049 | 729,311 | 752,984 | 699,864 | 653,641 |
| 2010's | 726,889 | 724,974 | 656,396 | 772,502 | 728,458 | 774,637 | 856,214 | 866,154 | 864,109 | 905,407 |
| 2020's | 880,891 |
| - = No Data Reported; -- = Not Applicable; NA = Not Available; W = Withheld to avoid disclosure of individual company data. |
| Release Date: 2/9/2022 |
| Next Release Date: Suspended |