|
Download Data (XLS File) |
|
|||||
|
|||||
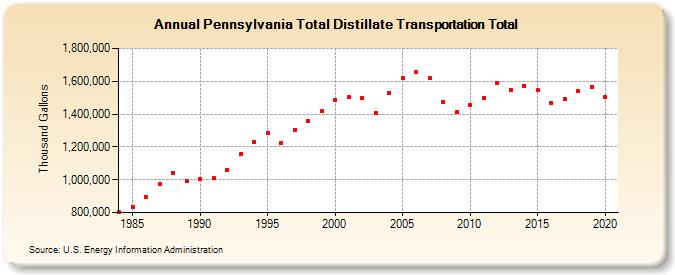
| Pennsylvania Total Distillate Transportation Total (Thousand Gallons) | |||||
| Decade | Year-0 | Year-1 | Year-2 | Year-3 | Year-4 | Year-5 | Year-6 | Year-7 | Year-8 | Year-9 |
|---|---|---|---|---|---|---|---|---|---|---|
| 1980's | 806,430 | 836,291 | 895,734 | 971,212 | 1,038,845 | 989,265 | ||||
| 1990's | 1,002,258 | 1,007,768 | 1,061,689 | 1,154,740 | 1,229,636 | 1,283,944 | 1,225,482 | 1,304,401 | 1,359,881 | 1,417,545 |
| 2000's | 1,483,860 | 1,502,376 | 1,497,390 | 1,407,682 | 1,529,578 | 1,619,704 | 1,654,285 | 1,619,211 | 1,470,569 | 1,411,523 |
| 2010's | 1,455,222 | 1,498,514 | 1,587,535 | 1,548,438 | 1,573,277 | 1,546,781 | 1,468,765 | 1,493,373 | 1,538,895 | 1,565,434 |
| 2020's | 1,506,100 |
| - = No Data Reported; -- = Not Applicable; NA = Not Available; W = Withheld to avoid disclosure of individual company data. |
| Release Date: 2/9/2022 |
| Next Release Date: Suspended |