|
Download Data (XLS File) |
|
|||||
|
|||||
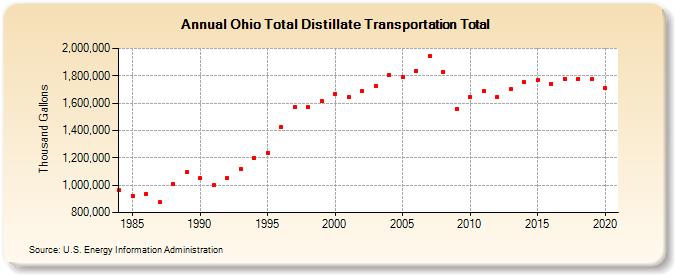
| Ohio Total Distillate Transportation Total (Thousand Gallons) | |||||
| Decade | Year-0 | Year-1 | Year-2 | Year-3 | Year-4 | Year-5 | Year-6 | Year-7 | Year-8 | Year-9 |
|---|---|---|---|---|---|---|---|---|---|---|
| 1980's | 961,977 | 923,582 | 937,666 | 877,017 | 1,010,038 | 1,093,081 | ||||
| 1990's | 1,051,468 | 998,429 | 1,050,577 | 1,121,767 | 1,201,398 | 1,235,426 | 1,421,947 | 1,568,355 | 1,569,986 | 1,613,361 |
| 2000's | 1,666,982 | 1,641,265 | 1,689,721 | 1,726,405 | 1,806,595 | 1,792,095 | 1,836,344 | 1,942,933 | 1,829,043 | 1,554,711 |
| 2010's | 1,644,120 | 1,689,366 | 1,646,849 | 1,700,827 | 1,755,263 | 1,768,086 | 1,741,580 | 1,779,123 | 1,777,694 | 1,773,669 |
| 2020's | 1,710,871 |
| - = No Data Reported; -- = Not Applicable; NA = Not Available; W = Withheld to avoid disclosure of individual company data. |
| Release Date: 2/9/2022 |
| Next Release Date: Suspended |