|
Download Data (XLS File) |
|
|||||
|
|||||
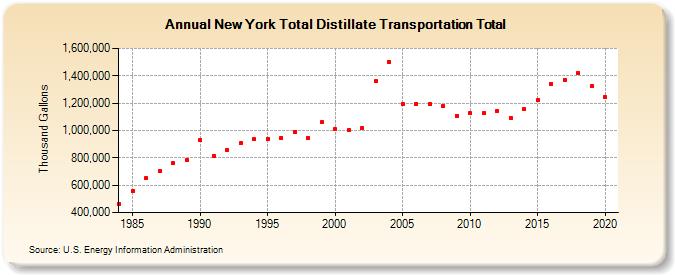
| New York Total Distillate Transportation Total (Thousand Gallons) | |||||
| Decade | Year-0 | Year-1 | Year-2 | Year-3 | Year-4 | Year-5 | Year-6 | Year-7 | Year-8 | Year-9 |
|---|---|---|---|---|---|---|---|---|---|---|
| 1980's | 460,912 | 559,902 | 649,735 | 701,433 | 761,721 | 783,142 | ||||
| 1990's | 929,414 | 816,607 | 854,974 | 904,973 | 935,012 | 939,290 | 946,119 | 992,047 | 946,128 | 1,059,738 |
| 2000's | 1,008,649 | 1,000,106 | 1,018,295 | 1,358,251 | 1,500,346 | 1,194,548 | 1,195,368 | 1,194,070 | 1,175,749 | 1,108,801 |
| 2010's | 1,124,113 | 1,128,953 | 1,143,223 | 1,094,265 | 1,154,080 | 1,220,685 | 1,341,520 | 1,372,580 | 1,420,374 | 1,323,215 |
| 2020's | 1,243,202 |
| - = No Data Reported; -- = Not Applicable; NA = Not Available; W = Withheld to avoid disclosure of individual company data. |
| Release Date: 2/9/2022 |
| Next Release Date: Suspended |