|
Download Data (XLS File) |
|
|||||
|
|||||
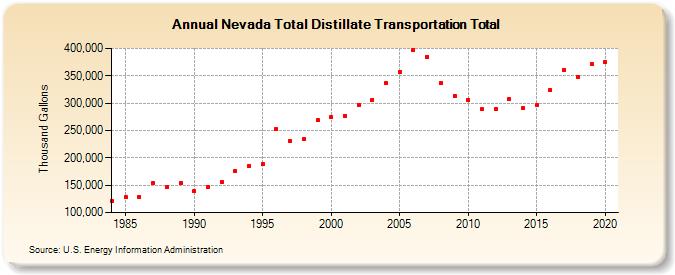
| Nevada Total Distillate Transportation Total (Thousand Gallons) | |||||
| Decade | Year-0 | Year-1 | Year-2 | Year-3 | Year-4 | Year-5 | Year-6 | Year-7 | Year-8 | Year-9 |
|---|---|---|---|---|---|---|---|---|---|---|
| 1980's | 121,288 | 127,842 | 128,629 | 153,858 | 146,380 | 154,396 | ||||
| 1990's | 138,595 | 146,156 | 156,621 | 176,304 | 185,293 | 188,179 | 252,893 | 230,741 | 233,831 | 268,612 |
| 2000's | 274,357 | 276,652 | 295,744 | 306,249 | 336,488 | 357,285 | 397,196 | 385,081 | 336,415 | 313,745 |
| 2010's | 306,346 | 288,473 | 289,926 | 307,761 | 290,598 | 297,264 | 324,164 | 360,679 | 348,494 | 371,368 |
| 2020's | 374,537 |
| - = No Data Reported; -- = Not Applicable; NA = Not Available; W = Withheld to avoid disclosure of individual company data. |
| Release Date: 2/9/2022 |
| Next Release Date: Suspended |