|
Download Data (XLS File) |
|
|||||
|
|||||
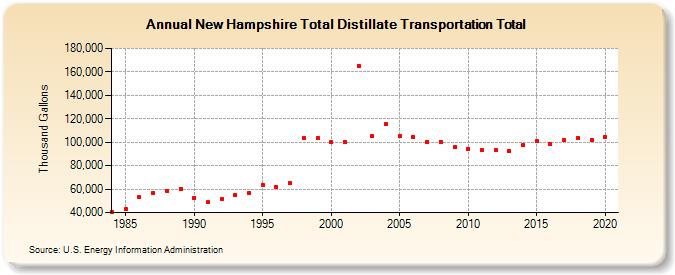
| New Hampshire Total Distillate Transportation Total (Thousand Gallons) | |||||
| Decade | Year-0 | Year-1 | Year-2 | Year-3 | Year-4 | Year-5 | Year-6 | Year-7 | Year-8 | Year-9 |
|---|---|---|---|---|---|---|---|---|---|---|
| 1980's | 40,694 | 42,765 | 52,954 | 56,256 | 58,774 | 59,984 | ||||
| 1990's | 52,770 | 48,597 | 51,740 | 55,031 | 56,446 | 63,750 | 61,853 | 64,995 | 103,778 | 103,864 |
| 2000's | 99,892 | 100,060 | 165,084 | 104,993 | 115,507 | 105,275 | 104,528 | 100,553 | 100,515 | 95,906 |
| 2010's | 94,577 | 93,297 | 93,074 | 92,788 | 97,495 | 100,688 | 98,447 | 101,656 | 103,831 | 101,760 |
| 2020's | 104,511 |
| - = No Data Reported; -- = Not Applicable; NA = Not Available; W = Withheld to avoid disclosure of individual company data. |
| Release Date: 2/9/2022 |
| Next Release Date: Suspended |