|
Download Data (XLS File) |
|
|||||
|
|||||
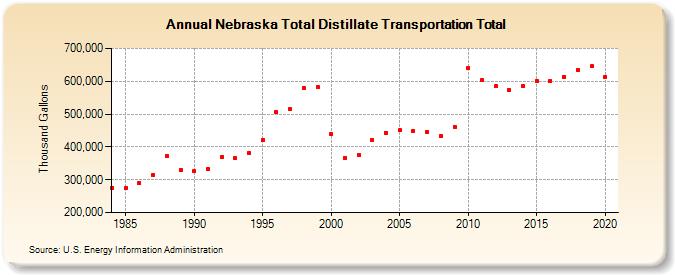
| Nebraska Total Distillate Transportation Total (Thousand Gallons) | |||||
| Decade | Year-0 | Year-1 | Year-2 | Year-3 | Year-4 | Year-5 | Year-6 | Year-7 | Year-8 | Year-9 |
|---|---|---|---|---|---|---|---|---|---|---|
| 1980's | 274,495 | 276,020 | 289,826 | 315,660 | 371,700 | 330,250 | ||||
| 1990's | 325,743 | 332,677 | 369,717 | 365,375 | 381,786 | 420,942 | 505,883 | 513,883 | 580,831 | 582,166 |
| 2000's | 437,893 | 367,585 | 376,638 | 419,906 | 443,568 | 450,463 | 449,621 | 446,825 | 433,745 | 461,938 |
| 2010's | 639,618 | 603,268 | 584,362 | 572,802 | 585,170 | 602,154 | 601,140 | 614,021 | 635,145 | 645,382 |
| 2020's | 613,885 |
| - = No Data Reported; -- = Not Applicable; NA = Not Available; W = Withheld to avoid disclosure of individual company data. |
| Release Date: 2/9/2022 |
| Next Release Date: Suspended |