|
Download Data (XLS File) |
|
|||||
|
|||||
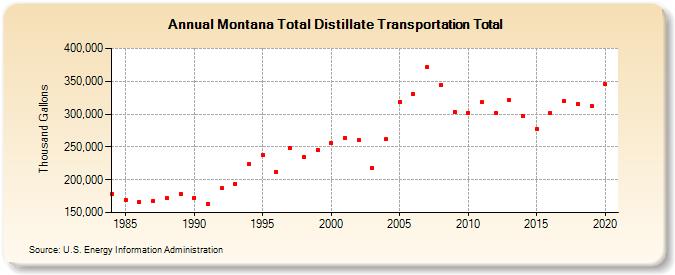
| Montana Total Distillate Transportation Total (Thousand Gallons) | |||||
| Decade | Year-0 | Year-1 | Year-2 | Year-3 | Year-4 | Year-5 | Year-6 | Year-7 | Year-8 | Year-9 |
|---|---|---|---|---|---|---|---|---|---|---|
| 1980's | 178,316 | 169,569 | 166,630 | 167,822 | 172,547 | 178,358 | ||||
| 1990's | 172,577 | 163,303 | 187,016 | 193,802 | 223,325 | 237,701 | 212,158 | 248,602 | 234,754 | 245,313 |
| 2000's | 255,508 | 263,999 | 259,970 | 218,591 | 261,284 | 318,751 | 330,904 | 371,406 | 344,887 | 303,587 |
| 2010's | 302,203 | 317,605 | 301,319 | 321,917 | 296,476 | 277,623 | 301,948 | 319,650 | 315,954 | 313,006 |
| 2020's | 345,687 |
| - = No Data Reported; -- = Not Applicable; NA = Not Available; W = Withheld to avoid disclosure of individual company data. |
| Release Date: 2/9/2022 |
| Next Release Date: Suspended |