|
Download Data (XLS File) |
|
|||||
|
|||||
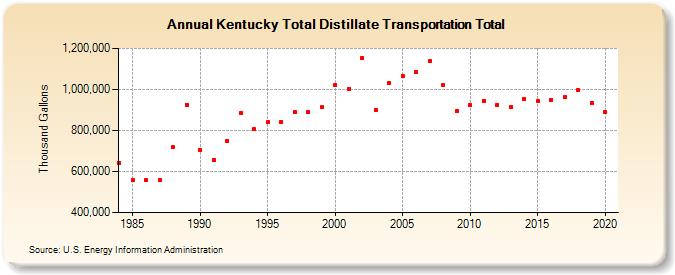
| Kentucky Total Distillate Transportation Total (Thousand Gallons) | |||||
| Decade | Year-0 | Year-1 | Year-2 | Year-3 | Year-4 | Year-5 | Year-6 | Year-7 | Year-8 | Year-9 |
|---|---|---|---|---|---|---|---|---|---|---|
| 1980's | 639,464 | 558,067 | 558,358 | 558,855 | 717,861 | 926,087 | ||||
| 1990's | 706,614 | 658,164 | 750,438 | 887,577 | 805,144 | 840,785 | 843,274 | 890,926 | 888,895 | 912,882 |
| 2000's | 1,022,958 | 1,003,832 | 1,154,918 | 897,396 | 1,031,560 | 1,067,187 | 1,082,690 | 1,136,693 | 1,019,963 | 893,284 |
| 2010's | 925,635 | 944,184 | 925,740 | 915,791 | 955,289 | 942,813 | 948,703 | 962,924 | 997,110 | 934,379 |
| 2020's | 890,662 |
| - = No Data Reported; -- = Not Applicable; NA = Not Available; W = Withheld to avoid disclosure of individual company data. |
| Release Date: 2/9/2022 |
| Next Release Date: Suspended |