|
Download Data (XLS File) |
|
|||||
|
|||||
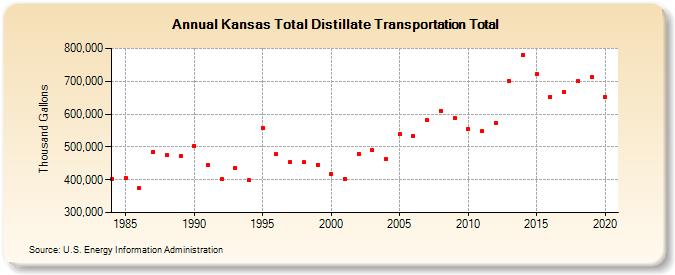
| Kansas Total Distillate Transportation Total (Thousand Gallons) | |||||
| Decade | Year-0 | Year-1 | Year-2 | Year-3 | Year-4 | Year-5 | Year-6 | Year-7 | Year-8 | Year-9 |
|---|---|---|---|---|---|---|---|---|---|---|
| 1980's | 401,280 | 405,881 | 375,437 | 485,957 | 475,683 | 472,593 | ||||
| 1990's | 503,106 | 444,110 | 403,219 | 436,062 | 398,245 | 558,873 | 477,105 | 452,880 | 453,403 | 445,713 |
| 2000's | 417,833 | 403,290 | 479,199 | 489,722 | 463,069 | 537,848 | 531,759 | 581,898 | 610,088 | 588,362 |
| 2010's | 554,334 | 548,183 | 573,992 | 700,399 | 781,010 | 721,678 | 653,229 | 667,508 | 699,999 | 711,445 |
| 2020's | 651,827 |
| - = No Data Reported; -- = Not Applicable; NA = Not Available; W = Withheld to avoid disclosure of individual company data. |
| Release Date: 2/9/2022 |
| Next Release Date: Suspended |