|
Download Data (XLS File) |
|
|||||
|
|||||
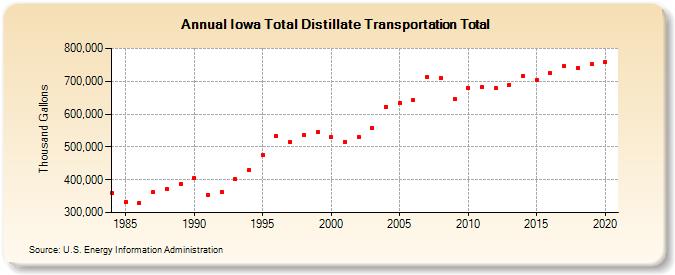
| Iowa Total Distillate Transportation Total (Thousand Gallons) | |||||
| Decade | Year-0 | Year-1 | Year-2 | Year-3 | Year-4 | Year-5 | Year-6 | Year-7 | Year-8 | Year-9 |
|---|---|---|---|---|---|---|---|---|---|---|
| 1980's | 358,604 | 332,751 | 329,936 | 361,748 | 371,207 | 385,635 | ||||
| 1990's | 404,690 | 354,380 | 363,384 | 401,673 | 429,212 | 475,093 | 533,345 | 516,056 | 535,405 | 546,778 |
| 2000's | 529,642 | 515,929 | 530,290 | 558,541 | 623,019 | 634,244 | 642,289 | 712,431 | 710,533 | 646,341 |
| 2010's | 680,343 | 683,094 | 679,270 | 689,626 | 717,014 | 704,841 | 724,844 | 745,207 | 740,327 | 751,669 |
| 2020's | 759,437 |
| - = No Data Reported; -- = Not Applicable; NA = Not Available; W = Withheld to avoid disclosure of individual company data. |
| Release Date: 2/9/2022 |
| Next Release Date: Suspended |