|
Download Data (XLS File) |
|
|||||
|
|||||
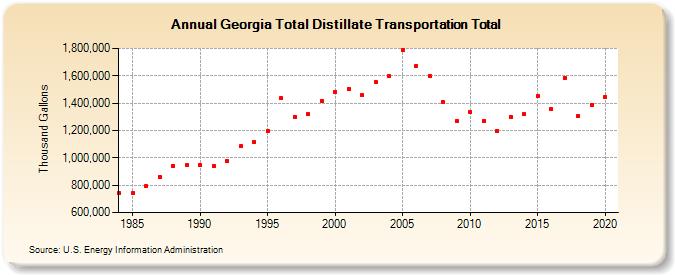
| Georgia Total Distillate Transportation Total (Thousand Gallons) | |||||
| Decade | Year-0 | Year-1 | Year-2 | Year-3 | Year-4 | Year-5 | Year-6 | Year-7 | Year-8 | Year-9 |
|---|---|---|---|---|---|---|---|---|---|---|
| 1980's | 740,364 | 746,538 | 791,469 | 862,724 | 942,027 | 944,408 | ||||
| 1990's | 948,549 | 938,578 | 974,788 | 1,083,332 | 1,116,036 | 1,194,866 | 1,434,721 | 1,298,502 | 1,317,965 | 1,418,436 |
| 2000's | 1,483,258 | 1,505,805 | 1,459,566 | 1,555,699 | 1,596,611 | 1,791,163 | 1,671,612 | 1,601,061 | 1,405,606 | 1,270,057 |
| 2010's | 1,337,346 | 1,271,299 | 1,196,253 | 1,299,659 | 1,318,541 | 1,451,999 | 1,356,717 | 1,586,901 | 1,307,029 | 1,389,139 |
| 2020's | 1,445,304 |
| - = No Data Reported; -- = Not Applicable; NA = Not Available; W = Withheld to avoid disclosure of individual company data. |
| Release Date: 2/9/2022 |
| Next Release Date: Suspended |