|
Download Data (XLS File) |
|
|||||
|
|||||
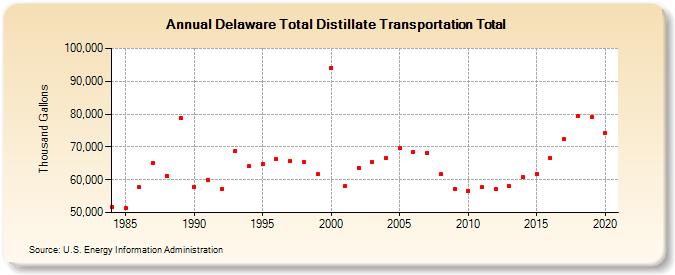
| Delaware Total Distillate Transportation Total (Thousand Gallons) | |||||
| Decade | Year-0 | Year-1 | Year-2 | Year-3 | Year-4 | Year-5 | Year-6 | Year-7 | Year-8 | Year-9 |
|---|---|---|---|---|---|---|---|---|---|---|
| 1980's | 51,660 | 51,427 | 57,667 | 65,243 | 61,243 | 78,866 | ||||
| 1990's | 57,918 | 60,003 | 57,197 | 68,638 | 64,061 | 64,728 | 66,220 | 65,771 | 65,541 | 61,653 |
| 2000's | 94,179 | 58,020 | 63,684 | 65,335 | 66,718 | 69,553 | 68,447 | 68,290 | 61,608 | 57,288 |
| 2010's | 56,706 | 57,688 | 57,294 | 57,963 | 60,700 | 61,880 | 66,670 | 72,390 | 79,442 | 79,053 |
| 2020's | 74,153 |
| - = No Data Reported; -- = Not Applicable; NA = Not Available; W = Withheld to avoid disclosure of individual company data. |
| Release Date: 2/9/2022 |
| Next Release Date: Suspended |