|
Download Data (XLS File) |
|
|||||
|
|||||
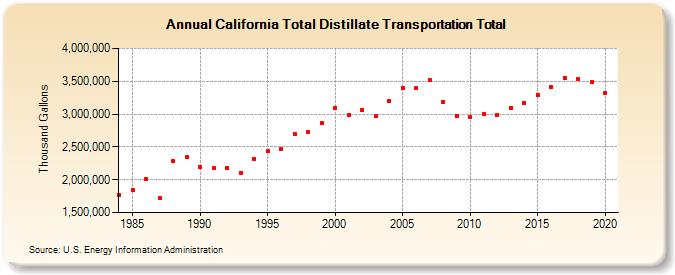
| California Total Distillate Transportation Total (Thousand Gallons) | |||||
| Decade | Year-0 | Year-1 | Year-2 | Year-3 | Year-4 | Year-5 | Year-6 | Year-7 | Year-8 | Year-9 |
|---|---|---|---|---|---|---|---|---|---|---|
| 1980's | 1,768,857 | 1,837,921 | 2,015,867 | 1,721,921 | 2,286,766 | 2,338,526 | ||||
| 1990's | 2,199,226 | 2,179,170 | 2,171,857 | 2,099,112 | 2,320,326 | 2,430,155 | 2,468,394 | 2,702,126 | 2,721,055 | 2,860,738 |
| 2000's | 3,089,862 | 2,988,571 | 3,068,805 | 2,966,975 | 3,200,356 | 3,403,120 | 3,399,522 | 3,513,366 | 3,188,036 | 2,975,281 |
| 2010's | 2,950,718 | 3,004,436 | 2,988,938 | 3,098,598 | 3,171,811 | 3,297,479 | 3,413,073 | 3,552,526 | 3,531,019 | 3,486,405 |
| 2020's | 3,319,924 |
| - = No Data Reported; -- = Not Applicable; NA = Not Available; W = Withheld to avoid disclosure of individual company data. |
| Release Date: 2/9/2022 |
| Next Release Date: Suspended |