|
Download Data (XLS File) |
|
|||||
|
|||||
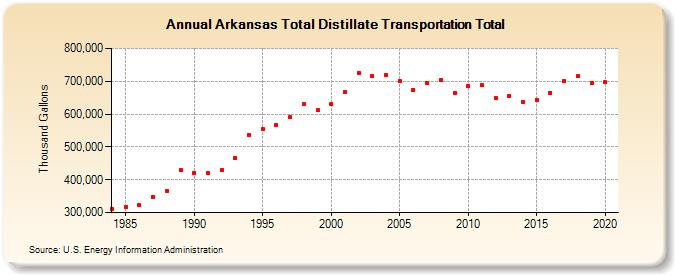
| Arkansas Total Distillate Transportation Total (Thousand Gallons) | |||||
| Decade | Year-0 | Year-1 | Year-2 | Year-3 | Year-4 | Year-5 | Year-6 | Year-7 | Year-8 | Year-9 |
|---|---|---|---|---|---|---|---|---|---|---|
| 1980's | 310,167 | 316,685 | 322,433 | 348,847 | 366,918 | 430,669 | ||||
| 1990's | 420,357 | 421,791 | 430,384 | 466,812 | 535,870 | 554,105 | 566,274 | 589,756 | 629,156 | 611,880 |
| 2000's | 630,645 | 665,787 | 725,613 | 716,585 | 719,809 | 702,178 | 673,740 | 693,736 | 704,912 | 665,174 |
| 2010's | 684,802 | 687,428 | 649,677 | 655,880 | 635,851 | 642,499 | 664,580 | 700,691 | 714,911 | 695,233 |
| 2020's | 696,467 |
| - = No Data Reported; -- = Not Applicable; NA = Not Available; W = Withheld to avoid disclosure of individual company data. |
| Release Date: 2/9/2022 |
| Next Release Date: Suspended |