|
Download Data (XLS File) |
|
|||||
|
|||||
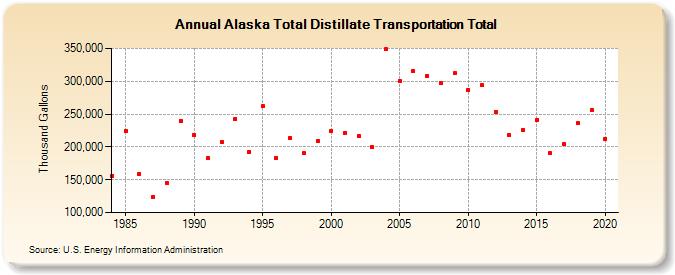
| Alaska Total Distillate Transportation Total (Thousand Gallons) | |||||
| Decade | Year-0 | Year-1 | Year-2 | Year-3 | Year-4 | Year-5 | Year-6 | Year-7 | Year-8 | Year-9 |
|---|---|---|---|---|---|---|---|---|---|---|
| 1980's | 156,256 | 224,003 | 159,398 | 124,335 | 144,644 | 239,595 | ||||
| 1990's | 217,726 | 182,963 | 207,795 | 242,400 | 192,720 | 261,707 | 183,169 | 214,131 | 190,255 | 209,105 |
| 2000's | 223,874 | 221,240 | 216,799 | 200,280 | 348,619 | 300,759 | 315,079 | 308,145 | 297,210 | 312,127 |
| 2010's | 287,127 | 293,813 | 253,359 | 217,906 | 226,077 | 240,684 | 190,536 | 203,681 | 236,240 | 255,920 |
| 2020's | 212,433 |
| - = No Data Reported; -- = Not Applicable; NA = Not Available; W = Withheld to avoid disclosure of individual company data. |
| Release Date: 2/9/2022 |
| Next Release Date: Suspended |