|
Download Data (XLS File) |
|
|||||
|
|||||
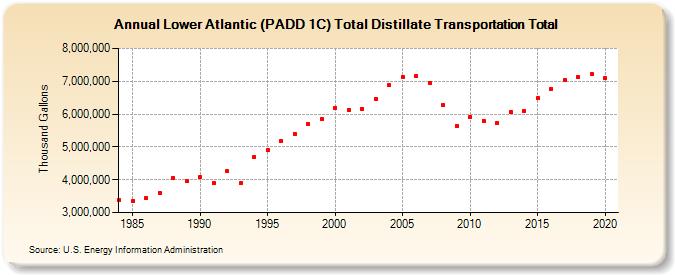
| Lower Atlantic (PADD 1C) Total Distillate Transportation Total (Thousand Gallons) | |||||
| Decade | Year-0 | Year-1 | Year-2 | Year-3 | Year-4 | Year-5 | Year-6 | Year-7 | Year-8 | Year-9 |
|---|---|---|---|---|---|---|---|---|---|---|
| 1980's | 3,387,741 | 3,340,463 | 3,436,358 | 3,609,980 | 4,049,374 | 3,952,044 | ||||
| 1990's | 4,070,603 | 3,891,540 | 4,256,486 | 3,888,980 | 4,687,732 | 4,891,663 | 5,167,564 | 5,401,105 | 5,686,263 | 5,861,975 |
| 2000's | 6,191,428 | 6,122,855 | 6,168,962 | 6,464,395 | 6,876,584 | 7,142,311 | 7,152,013 | 6,959,925 | 6,281,448 | 5,645,777 |
| 2010's | 5,910,867 | 5,803,059 | 5,719,798 | 6,065,474 | 6,096,700 | 6,494,971 | 6,770,950 | 7,026,237 | 7,121,649 | 7,225,164 |
| 2020's | 7,089,257 |
| - = No Data Reported; -- = Not Applicable; NA = Not Available; W = Withheld to avoid disclosure of individual company data. |
| Release Date: 2/9/2022 |
| Next Release Date: Suspended |