|
Download Data (XLS File) |
|
|||||
|
|||||
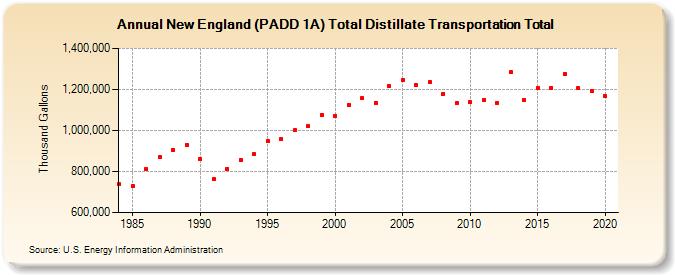
| New England (PADD 1A) Total Distillate Transportation Total (Thousand Gallons) | |||||
| Decade | Year-0 | Year-1 | Year-2 | Year-3 | Year-4 | Year-5 | Year-6 | Year-7 | Year-8 | Year-9 |
|---|---|---|---|---|---|---|---|---|---|---|
| 1980's | 737,047 | 729,486 | 812,961 | 868,676 | 907,238 | 930,912 | ||||
| 1990's | 861,113 | 763,190 | 814,305 | 857,894 | 884,788 | 948,238 | 957,096 | 1,000,384 | 1,020,082 | 1,076,253 |
| 2000's | 1,071,086 | 1,126,417 | 1,156,473 | 1,133,953 | 1,214,616 | 1,245,111 | 1,222,050 | 1,235,859 | 1,179,105 | 1,133,081 |
| 2010's | 1,137,452 | 1,148,219 | 1,136,141 | 1,283,214 | 1,150,848 | 1,208,379 | 1,209,221 | 1,277,176 | 1,205,602 | 1,193,603 |
| 2020's | 1,167,864 |
| - = No Data Reported; -- = Not Applicable; NA = Not Available; W = Withheld to avoid disclosure of individual company data. |
| Release Date: 2/9/2022 |
| Next Release Date: Suspended |