|
Download Data (XLS File) |
|
|||||
|
|||||
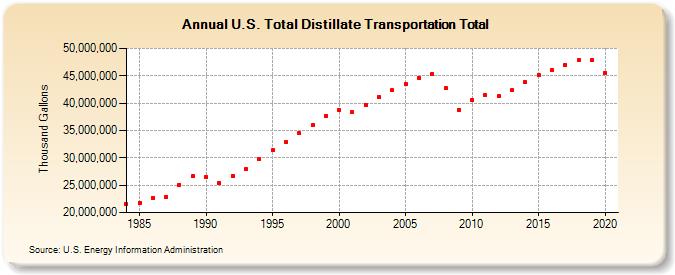
| U.S. Total Distillate Transportation Total (Thousand Gallons) | |||||
| Decade | Year-0 | Year-1 | Year-2 | Year-3 | Year-4 | Year-5 | Year-6 | Year-7 | Year-8 | Year-9 |
|---|---|---|---|---|---|---|---|---|---|---|
| 1980's | 21,505,899 | 21,765,114 | 22,726,242 | 22,888,086 | 25,126,200 | 26,630,806 | ||||
| 1990's | 26,529,949 | 25,410,537 | 26,766,188 | 27,913,703 | 29,773,279 | 31,344,272 | 32,896,400 | 34,465,623 | 35,925,392 | 37,720,827 |
| 2000's | 38,681,593 | 38,299,131 | 39,633,288 | 41,128,020 | 42,312,373 | 43,506,323 | 44,573,869 | 45,360,237 | 42,741,511 | 38,819,930 |
| 2010's | 40,560,101 | 41,414,854 | 41,229,545 | 42,375,310 | 43,797,127 | 45,129,642 | 45,973,001 | 47,005,302 | 47,831,240 | 47,849,547 |
| 2020's | 45,567,273 |
| - = No Data Reported; -- = Not Applicable; NA = Not Available; W = Withheld to avoid disclosure of individual company data. |
| Release Date: 2/9/2022 |
| Next Release Date: Suspended |