|
Download Data (XLS File) |
|
|||||
|
|||||
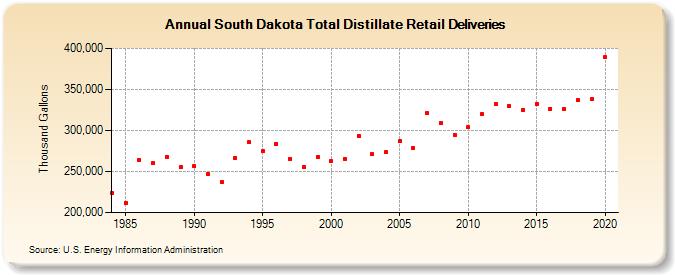
| South Dakota Total Distillate Retail Deliveries (Thousand Gallons) | |||||
| Decade | Year-0 | Year-1 | Year-2 | Year-3 | Year-4 | Year-5 | Year-6 | Year-7 | Year-8 | Year-9 |
|---|---|---|---|---|---|---|---|---|---|---|
| 1980's | 223,544 | 211,364 | 264,144 | 260,005 | 268,091 | 255,015 | ||||
| 1990's | 256,315 | 246,457 | 237,397 | 266,598 | 285,590 | 274,409 | 283,909 | 265,644 | 255,714 | 267,880 |
| 2000's | 262,607 | 265,664 | 293,314 | 271,023 | 273,698 | 287,008 | 279,180 | 320,995 | 308,949 | 295,050 |
| 2010's | 303,869 | 319,822 | 332,200 | 329,593 | 324,817 | 332,666 | 326,491 | 326,334 | 337,108 | 337,957 |
| 2020's | 389,199 |
| - = No Data Reported; -- = Not Applicable; NA = Not Available; W = Withheld to avoid disclosure of individual company data. |
| Release Date: 2/9/2022 |
| Next Release Date: Suspended |