|
Download Data (XLS File) |
|
|||||
|
|||||
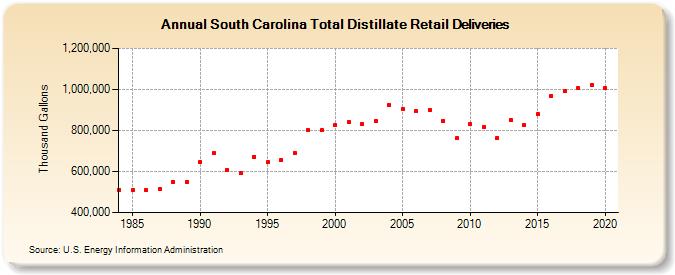
| South Carolina Total Distillate Retail Deliveries (Thousand Gallons) | |||||
| Decade | Year-0 | Year-1 | Year-2 | Year-3 | Year-4 | Year-5 | Year-6 | Year-7 | Year-8 | Year-9 |
|---|---|---|---|---|---|---|---|---|---|---|
| 1980's | 511,348 | 507,742 | 509,730 | 516,634 | 550,915 | 550,822 | ||||
| 1990's | 647,413 | 689,834 | 608,266 | 591,380 | 672,163 | 644,343 | 656,326 | 692,447 | 800,933 | 800,151 |
| 2000's | 824,344 | 839,131 | 831,650 | 846,499 | 923,424 | 904,187 | 893,469 | 900,294 | 847,622 | 761,956 |
| 2010's | 831,936 | 817,635 | 763,317 | 851,931 | 826,142 | 879,378 | 969,284 | 990,876 | 1,005,258 | 1,022,825 |
| 2020's | 1,007,862 |
| - = No Data Reported; -- = Not Applicable; NA = Not Available; W = Withheld to avoid disclosure of individual company data. |
| Release Date: 2/9/2022 |
| Next Release Date: Suspended |