|
Download Data (XLS File) |
|
|||||
|
|||||
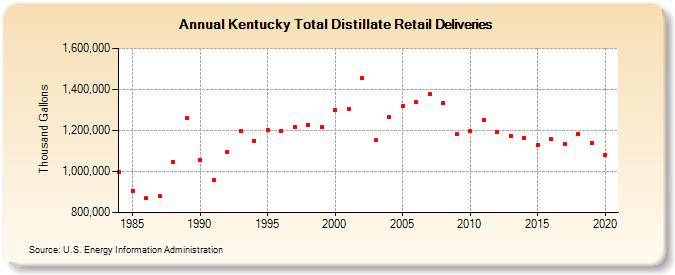
| Kentucky Total Distillate Retail Deliveries (Thousand Gallons) | |||||
| Decade | Year-0 | Year-1 | Year-2 | Year-3 | Year-4 | Year-5 | Year-6 | Year-7 | Year-8 | Year-9 |
|---|---|---|---|---|---|---|---|---|---|---|
| 1980's | 998,172 | 906,538 | 869,063 | 880,375 | 1,048,070 | 1,259,451 | ||||
| 1990's | 1,055,193 | 958,273 | 1,094,052 | 1,197,519 | 1,150,442 | 1,203,350 | 1,199,043 | 1,217,943 | 1,228,750 | 1,214,897 |
| 2000's | 1,298,737 | 1,305,207 | 1,456,839 | 1,151,355 | 1,266,015 | 1,317,676 | 1,337,808 | 1,376,160 | 1,333,703 | 1,182,119 |
| 2010's | 1,195,223 | 1,250,277 | 1,191,598 | 1,175,312 | 1,162,430 | 1,128,838 | 1,159,496 | 1,135,255 | 1,183,003 | 1,137,352 |
| 2020's | 1,082,331 |
| - = No Data Reported; -- = Not Applicable; NA = Not Available; W = Withheld to avoid disclosure of individual company data. |
| Release Date: 2/9/2022 |
| Next Release Date: Suspended |