|
Download Data (XLS File) |
|
|||||
|
|||||
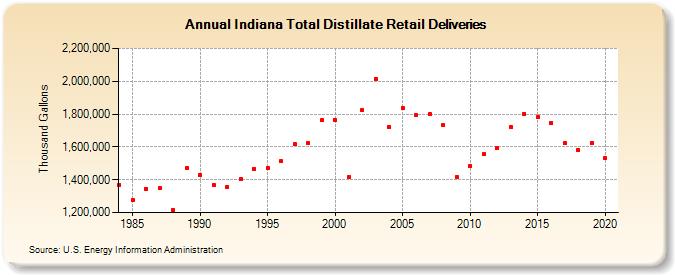
| Indiana Total Distillate Retail Deliveries (Thousand Gallons) | |||||
| Decade | Year-0 | Year-1 | Year-2 | Year-3 | Year-4 | Year-5 | Year-6 | Year-7 | Year-8 | Year-9 |
|---|---|---|---|---|---|---|---|---|---|---|
| 1980's | 1,369,851 | 1,275,187 | 1,346,226 | 1,348,053 | 1,215,244 | 1,472,196 | ||||
| 1990's | 1,429,186 | 1,366,108 | 1,358,418 | 1,405,324 | 1,466,877 | 1,474,424 | 1,511,180 | 1,615,545 | 1,620,944 | 1,763,324 |
| 2000's | 1,762,952 | 1,417,745 | 1,822,384 | 2,014,396 | 1,723,486 | 1,837,846 | 1,791,329 | 1,797,540 | 1,731,780 | 1,417,072 |
| 2010's | 1,484,714 | 1,555,026 | 1,590,955 | 1,719,639 | 1,800,900 | 1,780,935 | 1,746,064 | 1,621,586 | 1,580,680 | 1,621,635 |
| 2020's | 1,530,532 |
| - = No Data Reported; -- = Not Applicable; NA = Not Available; W = Withheld to avoid disclosure of individual company data. |
| Release Date: 2/9/2022 |
| Next Release Date: Suspended |