|
Download Data (XLS File) |
|
|||||
|
|||||
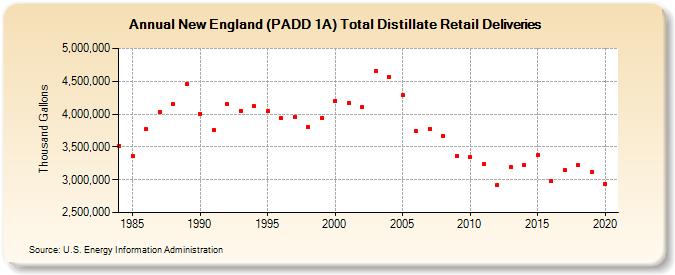
| New England (PADD 1A) Total Distillate Retail Deliveries (Thousand Gallons) | |||||
| Decade | Year-0 | Year-1 | Year-2 | Year-3 | Year-4 | Year-5 | Year-6 | Year-7 | Year-8 | Year-9 |
|---|---|---|---|---|---|---|---|---|---|---|
| 1980's | 3,520,444 | 3,364,702 | 3,768,390 | 4,037,250 | 4,151,915 | 4,456,252 | ||||
| 1990's | 4,007,833 | 3,764,473 | 4,147,805 | 4,052,925 | 4,116,785 | 4,044,594 | 3,940,837 | 3,952,368 | 3,800,101 | 3,942,619 |
| 2000's | 4,203,572 | 4,174,329 | 4,104,730 | 4,652,310 | 4,569,750 | 4,285,426 | 3,738,092 | 3,776,398 | 3,672,567 | 3,364,926 |
| 2010's | 3,352,332 | 3,235,738 | 2,927,219 | 3,189,881 | 3,225,423 | 3,372,578 | 2,976,348 | 3,152,421 | 3,217,367 | 3,118,214 |
| 2020's | 2,935,745 |
| - = No Data Reported; -- = Not Applicable; NA = Not Available; W = Withheld to avoid disclosure of individual company data. |
| Release Date: 2/9/2022 |
| Next Release Date: Suspended |