|
Download Data (XLS File) |
|
|||||
|
|||||
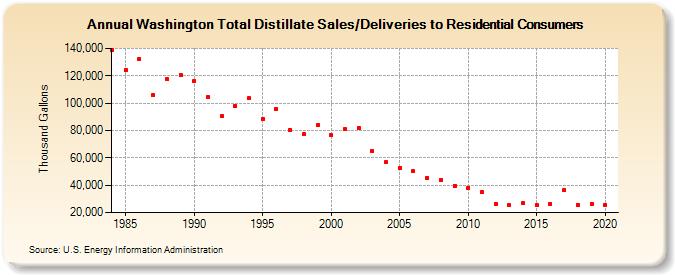
| Washington Total Distillate Sales/Deliveries to Residential Consumers (Thousand Gallons) | |||||
| Decade | Year-0 | Year-1 | Year-2 | Year-3 | Year-4 | Year-5 | Year-6 | Year-7 | Year-8 | Year-9 |
|---|---|---|---|---|---|---|---|---|---|---|
| 1980's | 138,550 | 124,027 | 132,283 | 105,818 | 117,356 | 120,587 | ||||
| 1990's | 115,915 | 104,802 | 90,347 | 98,089 | 103,434 | 88,480 | 95,728 | 80,548 | 77,169 | 83,878 |
| 2000's | 76,372 | 80,778 | 81,914 | 64,940 | 56,734 | 52,465 | 50,123 | 45,457 | 43,662 | 39,599 |
| 2010's | 38,272 | 34,895 | 26,269 | 25,220 | 26,927 | 25,523 | 26,266 | 36,240 | 25,568 | 26,455 |
| 2020's | 25,874 |
| - = No Data Reported; -- = Not Applicable; NA = Not Available; W = Withheld to avoid disclosure of individual company data. |
| Release Date: 2/9/2022 |
| Next Release Date: Suspended |