|
Download Data (XLS File) |
|
|||||
|
|||||
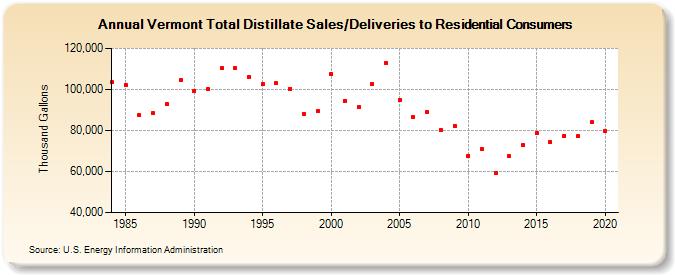
| Vermont Total Distillate Sales/Deliveries to Residential Consumers (Thousand Gallons) | |||||
| Decade | Year-0 | Year-1 | Year-2 | Year-3 | Year-4 | Year-5 | Year-6 | Year-7 | Year-8 | Year-9 |
|---|---|---|---|---|---|---|---|---|---|---|
| 1980's | 103,434 | 102,267 | 87,446 | 88,368 | 92,661 | 104,429 | ||||
| 1990's | 99,356 | 99,984 | 110,434 | 110,253 | 105,871 | 102,521 | 102,922 | 100,454 | 88,183 | 89,415 |
| 2000's | 107,758 | 94,555 | 91,304 | 102,636 | 112,969 | 94,728 | 86,426 | 88,989 | 80,241 | 82,400 |
| 2010's | 67,746 | 70,891 | 59,393 | 67,373 | 72,797 | 78,635 | 74,335 | 77,502 | 77,172 | 83,922 |
| 2020's | 79,600 |
| - = No Data Reported; -- = Not Applicable; NA = Not Available; W = Withheld to avoid disclosure of individual company data. |
| Release Date: 2/9/2022 |
| Next Release Date: Suspended |