|
Download Data (XLS File) |
|
|||||
|
|||||
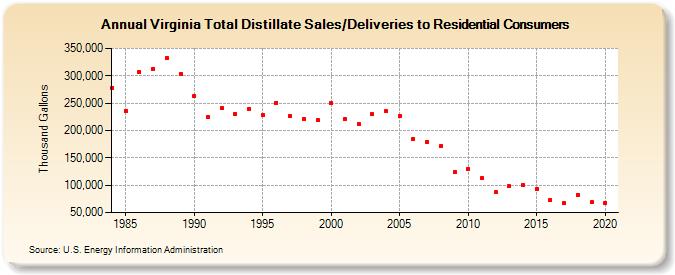
| Virginia Total Distillate Sales/Deliveries to Residential Consumers (Thousand Gallons) | |||||
| Decade | Year-0 | Year-1 | Year-2 | Year-3 | Year-4 | Year-5 | Year-6 | Year-7 | Year-8 | Year-9 |
|---|---|---|---|---|---|---|---|---|---|---|
| 1980's | 278,479 | 236,463 | 307,284 | 312,637 | 332,782 | 303,435 | ||||
| 1990's | 263,009 | 225,534 | 241,017 | 230,524 | 239,937 | 227,959 | 250,809 | 226,854 | 220,498 | 219,594 |
| 2000's | 249,735 | 220,962 | 210,973 | 229,469 | 234,702 | 226,206 | 184,482 | 179,774 | 171,386 | 123,458 |
| 2010's | 130,030 | 113,065 | 87,090 | 97,821 | 100,359 | 93,804 | 73,219 | 67,244 | 82,929 | 68,851 |
| 2020's | 67,806 |
| - = No Data Reported; -- = Not Applicable; NA = Not Available; W = Withheld to avoid disclosure of individual company data. |
| Release Date: 2/9/2022 |
| Next Release Date: Suspended |