|
Download Data (XLS File) |
|
|||||
|
|||||
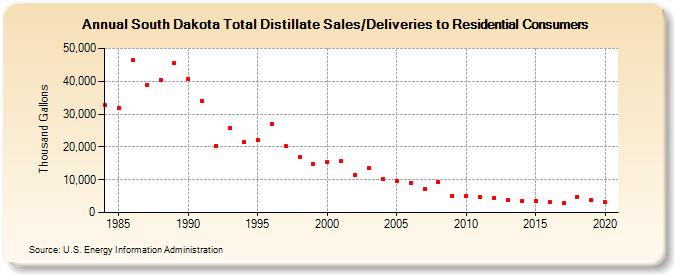
| South Dakota Total Distillate Sales/Deliveries to Residential Consumers (Thousand Gallons) | |||||
| Decade | Year-0 | Year-1 | Year-2 | Year-3 | Year-4 | Year-5 | Year-6 | Year-7 | Year-8 | Year-9 |
|---|---|---|---|---|---|---|---|---|---|---|
| 1980's | 32,747 | 31,795 | 46,483 | 38,854 | 40,390 | 45,547 | ||||
| 1990's | 40,555 | 34,008 | 20,382 | 25,888 | 21,432 | 22,137 | 27,085 | 20,134 | 16,791 | 14,912 |
| 2000's | 15,414 | 15,602 | 11,547 | 13,603 | 10,319 | 9,609 | 8,945 | 7,291 | 9,365 | 5,130 |
| 2010's | 5,147 | 4,872 | 4,530 | 3,844 | 3,518 | 3,440 | 3,137 | 2,852 | 4,802 | 3,873 |
| 2020's | 3,093 |
| - = No Data Reported; -- = Not Applicable; NA = Not Available; W = Withheld to avoid disclosure of individual company data. |
| Release Date: 2/9/2022 |
| Next Release Date: Suspended |