|
Download Data (XLS File) |
|
|||||
|
|||||
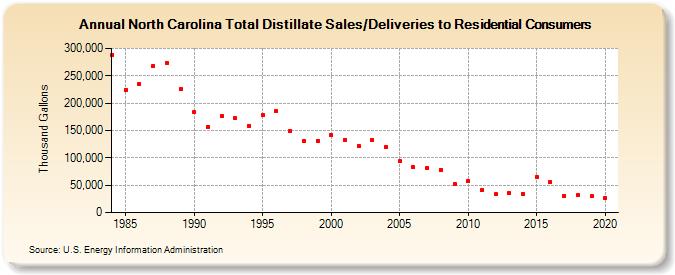
| North Carolina Total Distillate Sales/Deliveries to Residential Consumers (Thousand Gallons) | |||||
| Decade | Year-0 | Year-1 | Year-2 | Year-3 | Year-4 | Year-5 | Year-6 | Year-7 | Year-8 | Year-9 |
|---|---|---|---|---|---|---|---|---|---|---|
| 1980's | 288,082 | 224,545 | 235,618 | 267,655 | 273,796 | 225,742 | ||||
| 1990's | 183,115 | 157,197 | 176,502 | 172,043 | 159,069 | 177,670 | 185,044 | 149,067 | 131,451 | 131,627 |
| 2000's | 142,382 | 132,840 | 121,287 | 132,353 | 120,172 | 93,493 | 82,784 | 81,348 | 78,241 | 51,799 |
| 2010's | 57,587 | 41,293 | 33,122 | 35,607 | 34,806 | 65,526 | 55,741 | 30,466 | 32,052 | 29,591 |
| 2020's | 26,625 |
| - = No Data Reported; -- = Not Applicable; NA = Not Available; W = Withheld to avoid disclosure of individual company data. |
| Release Date: 2/9/2022 |
| Next Release Date: Suspended |