|
Download Data (XLS File) |
|
|||||
|
|||||
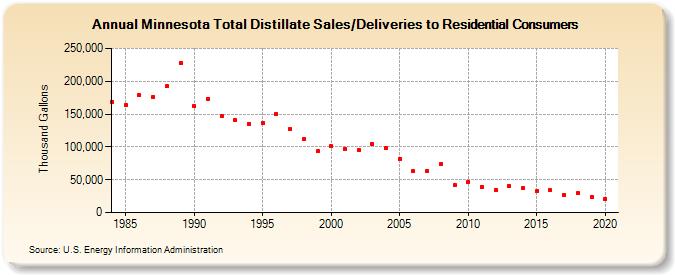
| Minnesota Total Distillate Sales/Deliveries to Residential Consumers (Thousand Gallons) | |||||
| Decade | Year-0 | Year-1 | Year-2 | Year-3 | Year-4 | Year-5 | Year-6 | Year-7 | Year-8 | Year-9 |
|---|---|---|---|---|---|---|---|---|---|---|
| 1980's | 168,745 | 163,712 | 178,620 | 176,409 | 192,125 | 227,397 | ||||
| 1990's | 162,238 | 173,405 | 147,363 | 140,382 | 135,283 | 136,254 | 150,007 | 127,576 | 111,632 | 93,223 |
| 2000's | 100,882 | 97,450 | 95,716 | 104,485 | 98,500 | 82,104 | 62,855 | 63,696 | 73,425 | 41,484 |
| 2010's | 47,274 | 39,560 | 34,118 | 40,144 | 36,925 | 32,103 | 33,850 | 27,262 | 29,051 | 23,540 |
| 2020's | 21,300 |
| - = No Data Reported; -- = Not Applicable; NA = Not Available; W = Withheld to avoid disclosure of individual company data. |
| Release Date: 2/9/2022 |
| Next Release Date: Suspended |