|
Download Data (XLS File) |
|
|||||
|
|||||
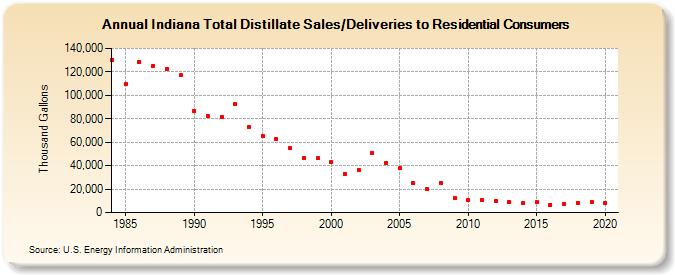
| Indiana Total Distillate Sales/Deliveries to Residential Consumers (Thousand Gallons) | |||||
| Decade | Year-0 | Year-1 | Year-2 | Year-3 | Year-4 | Year-5 | Year-6 | Year-7 | Year-8 | Year-9 |
|---|---|---|---|---|---|---|---|---|---|---|
| 1980's | 130,288 | 109,437 | 128,769 | 125,335 | 122,680 | 117,061 | ||||
| 1990's | 86,565 | 81,988 | 81,601 | 92,299 | 73,051 | 65,186 | 62,906 | 55,000 | 46,309 | 46,445 |
| 2000's | 42,909 | 33,187 | 36,407 | 50,862 | 42,586 | 37,706 | 25,004 | 19,667 | 25,346 | 12,384 |
| 2010's | 10,463 | 11,098 | 9,892 | 8,839 | 8,516 | 8,942 | 6,747 | 7,120 | 8,422 | 9,342 |
| 2020's | 7,813 |
| - = No Data Reported; -- = Not Applicable; NA = Not Available; W = Withheld to avoid disclosure of individual company data. |
| Release Date: 2/9/2022 |
| Next Release Date: Suspended |