|
Download Data (XLS File) |
|
|||||
|
|||||
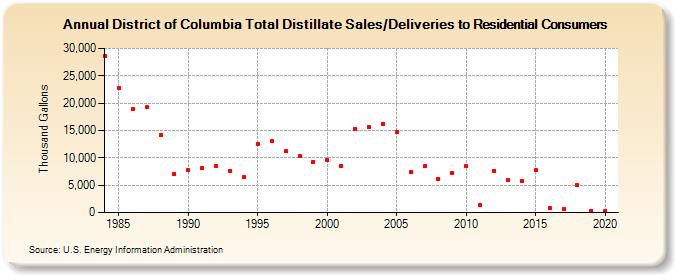
| District of Columbia Total Distillate Sales/Deliveries to Residential Consumers (Thousand Gallons) | |||||
| Decade | Year-0 | Year-1 | Year-2 | Year-3 | Year-4 | Year-5 | Year-6 | Year-7 | Year-8 | Year-9 |
|---|---|---|---|---|---|---|---|---|---|---|
| 1980's | 28,597 | 22,798 | 18,852 | 19,270 | 14,089 | 7,029 | ||||
| 1990's | 7,694 | 8,106 | 8,563 | 7,640 | 6,514 | 12,558 | 13,134 | 11,230 | 10,330 | 9,255 |
| 2000's | 9,582 | 8,481 | 15,199 | 15,685 | 16,211 | 14,715 | 7,453 | 8,450 | 6,185 | 7,174 |
| 2010's | 8,501 | 1,430 | 7,653 | 5,927 | 5,744 | 7,776 | 805 | 688 | 4,981 | 372 |
| 2020's | 293 |
| - = No Data Reported; -- = Not Applicable; NA = Not Available; W = Withheld to avoid disclosure of individual company data. |
| Release Date: 2/9/2022 |
| Next Release Date: Suspended |