|
Download Data (XLS File) |
|
|||||
|
|||||
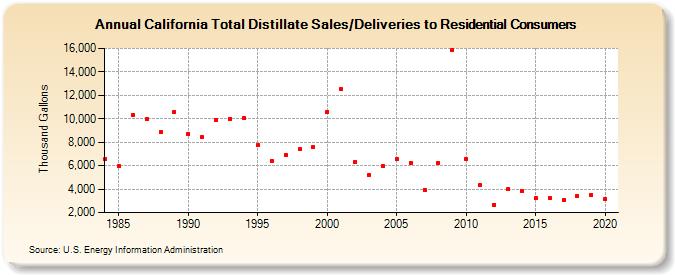
| California Total Distillate Sales/Deliveries to Residential Consumers (Thousand Gallons) | |||||
| Decade | Year-0 | Year-1 | Year-2 | Year-3 | Year-4 | Year-5 | Year-6 | Year-7 | Year-8 | Year-9 |
|---|---|---|---|---|---|---|---|---|---|---|
| 1980's | 6,538 | 5,934 | 10,321 | 9,966 | 8,851 | 10,578 | ||||
| 1990's | 8,737 | 8,407 | 9,914 | 10,003 | 10,061 | 7,735 | 6,423 | 6,914 | 7,415 | 7,594 |
| 2000's | 10,604 | 12,502 | 6,338 | 5,222 | 5,970 | 6,536 | 6,252 | 3,953 | 6,234 | 15,850 |
| 2010's | 6,540 | 4,362 | 2,666 | 3,974 | 3,880 | 3,209 | 3,265 | 3,106 | 3,401 | 3,503 |
| 2020's | 3,171 |
| - = No Data Reported; -- = Not Applicable; NA = Not Available; W = Withheld to avoid disclosure of individual company data. |
| Release Date: 2/9/2022 |
| Next Release Date: Suspended |