|
Download Data (XLS File) |
|
|||||
|
|||||
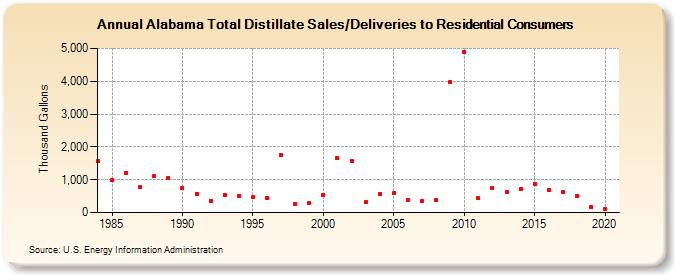
| Alabama Total Distillate Sales/Deliveries to Residential Consumers (Thousand Gallons) | |||||
| Decade | Year-0 | Year-1 | Year-2 | Year-3 | Year-4 | Year-5 | Year-6 | Year-7 | Year-8 | Year-9 |
|---|---|---|---|---|---|---|---|---|---|---|
| 1980's | 1,567 | 986 | 1,217 | 769 | 1,117 | 1,055 | ||||
| 1990's | 751 | 580 | 349 | 528 | 501 | 461 | 437 | 1,741 | 262 | 288 |
| 2000's | 537 | 1,647 | 1,578 | 329 | 555 | 588 | 379 | 344 | 396 | 3,971 |
| 2010's | 4,895 | 432 | 750 | 639 | 722 | 870 | 681 | 630 | 503 | 168 |
| 2020's | 103 |
| - = No Data Reported; -- = Not Applicable; NA = Not Available; W = Withheld to avoid disclosure of individual company data. |
| Release Date: 2/9/2022 |
| Next Release Date: Suspended |