|
Download Data (XLS File) |
|
|||||
|
|||||
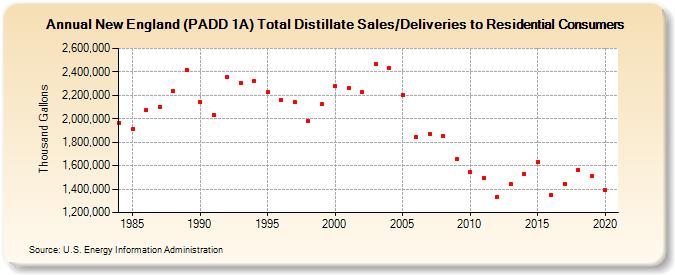
| New England (PADD 1A) Total Distillate Sales/Deliveries to Residential Consumers (Thousand Gallons) | |||||
| Decade | Year-0 | Year-1 | Year-2 | Year-3 | Year-4 | Year-5 | Year-6 | Year-7 | Year-8 | Year-9 |
|---|---|---|---|---|---|---|---|---|---|---|
| 1980's | 1,962,096 | 1,909,202 | 2,074,274 | 2,103,404 | 2,237,744 | 2,417,886 | ||||
| 1990's | 2,143,653 | 2,029,119 | 2,352,734 | 2,302,502 | 2,317,953 | 2,228,279 | 2,156,102 | 2,142,358 | 1,984,396 | 2,123,587 |
| 2000's | 2,278,430 | 2,259,990 | 2,226,579 | 2,466,734 | 2,436,994 | 2,205,699 | 1,843,037 | 1,871,074 | 1,848,757 | 1,652,797 |
| 2010's | 1,549,060 | 1,493,889 | 1,334,127 | 1,441,278 | 1,530,247 | 1,631,182 | 1,349,724 | 1,445,508 | 1,565,470 | 1,512,213 |
| 2020's | 1,391,177 |
| - = No Data Reported; -- = Not Applicable; NA = Not Available; W = Withheld to avoid disclosure of individual company data. |
| Release Date: 2/9/2022 |
| Next Release Date: Suspended |