|
Download Data (XLS File) |
|
|||||
|
|||||
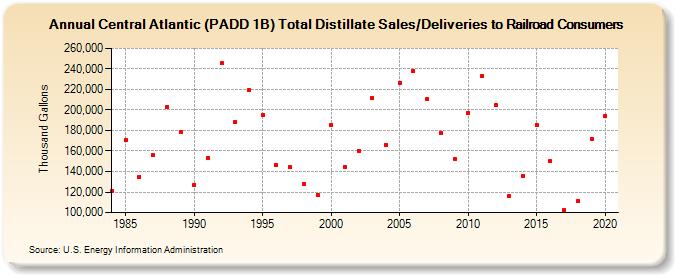
| Central Atlantic (PADD 1B) Total Distillate Sales/Deliveries to Railroad Consumers (Thousand Gallons) | |||||
| Decade | Year-0 | Year-1 | Year-2 | Year-3 | Year-4 | Year-5 | Year-6 | Year-7 | Year-8 | Year-9 |
|---|---|---|---|---|---|---|---|---|---|---|
| 1980's | 120,527 | 170,512 | 134,851 | 156,154 | 203,260 | 178,330 | ||||
| 1990's | 127,338 | 153,478 | 245,354 | 188,709 | 219,635 | 195,481 | 146,456 | 144,230 | 128,258 | 117,168 |
| 2000's | 185,720 | 144,833 | 160,288 | 211,960 | 166,292 | 226,753 | 237,830 | 210,461 | 177,750 | 152,309 |
| 2010's | 196,570 | 233,005 | 204,527 | 115,995 | 135,543 | 185,420 | 150,003 | 102,008 | 111,193 | 172,024 |
| 2020's | 194,204 |
| - = No Data Reported; -- = Not Applicable; NA = Not Available; W = Withheld to avoid disclosure of individual company data. |
| Release Date: 2/9/2022 |
| Next Release Date: Suspended |