|
Download Data (XLS File) |
|
|||||
|
|||||
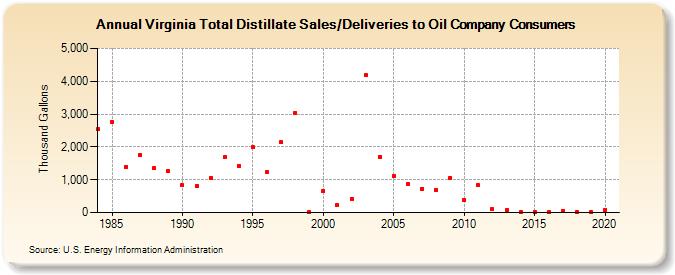
| Virginia Total Distillate Sales/Deliveries to Oil Company Consumers (Thousand Gallons) | |||||
| Decade | Year-0 | Year-1 | Year-2 | Year-3 | Year-4 | Year-5 | Year-6 | Year-7 | Year-8 | Year-9 |
|---|---|---|---|---|---|---|---|---|---|---|
| 1980's | 2,536 | 2,767 | 1,390 | 1,759 | 1,354 | 1,251 | ||||
| 1990's | 826 | 815 | 1,050 | 1,684 | 1,429 | 1,983 | 1,226 | 2,140 | 3,045 | 3 |
| 2000's | 653 | 218 | 425 | 4,175 | 1,707 | 1,123 | 877 | 731 | 681 | 1,045 |
| 2010's | 383 | 826 | 101 | 70 | 17 | 25 | 17 | 42 | 3 | 4 |
| 2020's | 89 |
| - = No Data Reported; -- = Not Applicable; NA = Not Available; W = Withheld to avoid disclosure of individual company data. |
| Release Date: 2/9/2022 |
| Next Release Date: Suspended |