|
Download Data (XLS File) |
|
|||||
|
|||||
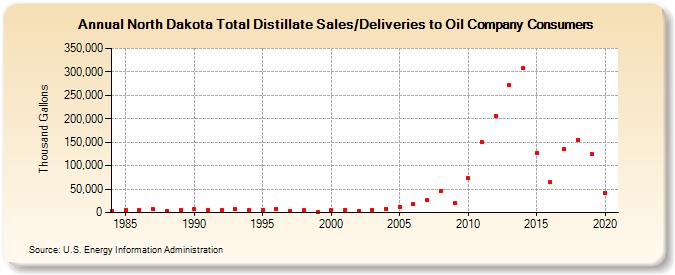
| North Dakota Total Distillate Sales/Deliveries to Oil Company Consumers (Thousand Gallons) | |||||
| Decade | Year-0 | Year-1 | Year-2 | Year-3 | Year-4 | Year-5 | Year-6 | Year-7 | Year-8 | Year-9 |
|---|---|---|---|---|---|---|---|---|---|---|
| 1980's | 3,923 | 4,484 | 5,255 | 6,580 | 2,809 | 5,326 | ||||
| 1990's | 6,644 | 5,907 | 5,793 | 7,135 | 4,560 | 6,208 | 8,449 | 3,612 | 4,564 | 1,756 |
| 2000's | 5,944 | 5,955 | 3,838 | 6,009 | 8,651 | 12,294 | 18,602 | 26,059 | 45,464 | 21,021 |
| 2010's | 73,015 | 151,289 | 206,112 | 270,900 | 307,560 | 126,662 | 64,795 | 134,662 | 154,714 | 125,392 |
| 2020's | 42,591 |
| - = No Data Reported; -- = Not Applicable; NA = Not Available; W = Withheld to avoid disclosure of individual company data. |
| Release Date: 2/9/2022 |
| Next Release Date: Suspended |