|
Download Data (XLS File) |
|
|||||
|
|||||
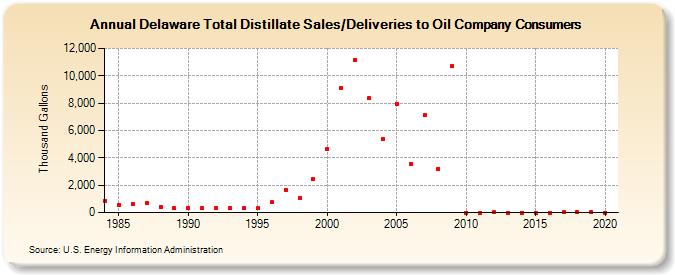
| Delaware Total Distillate Sales/Deliveries to Oil Company Consumers (Thousand Gallons) | |||||
| Decade | Year-0 | Year-1 | Year-2 | Year-3 | Year-4 | Year-5 | Year-6 | Year-7 | Year-8 | Year-9 |
|---|---|---|---|---|---|---|---|---|---|---|
| 1980's | 860 | 561 | 611 | 707 | 432 | 309 | ||||
| 1990's | 355 | 342 | 343 | 322 | 311 | 305 | 769 | 1,668 | 1,050 | 2,488 |
| 2000's | 4,642 | 9,132 | 11,183 | 8,343 | 5,348 | 7,945 | 3,580 | 7,100 | 3,210 | 10,694 |
| 2010's | 3 | 4 | 5 | 3 | 0 | 0 | 2 | 10 | 11 | 7 |
| 2020's | 0 |
| - = No Data Reported; -- = Not Applicable; NA = Not Available; W = Withheld to avoid disclosure of individual company data. |
| Release Date: 2/9/2022 |
| Next Release Date: Suspended |