|
Download Data (XLS File) |
|
|||||
|
|||||
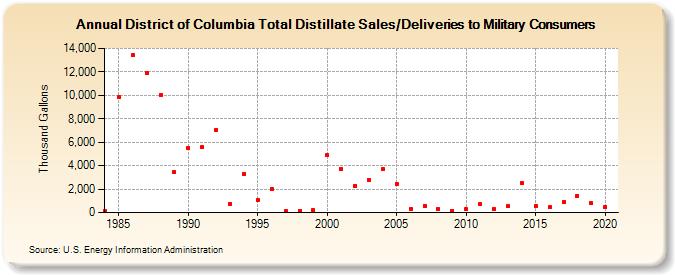
| District of Columbia Total Distillate Sales/Deliveries to Military Consumers (Thousand Gallons) | |||||
| Decade | Year-0 | Year-1 | Year-2 | Year-3 | Year-4 | Year-5 | Year-6 | Year-7 | Year-8 | Year-9 |
|---|---|---|---|---|---|---|---|---|---|---|
| 1980's | 113 | 9,820 | 13,414 | 11,905 | 10,046 | 3,444 | ||||
| 1990's | 5,507 | 5,557 | 7,064 | 760 | 3,276 | 1,050 | 2,048 | 135 | 162 | 195 |
| 2000's | 4,871 | 3,701 | 2,268 | 2,808 | 3,692 | 2,450 | 324 | 598 | 291 | 165 |
| 2010's | 265 | 693 | 300 | 518 | 2,505 | 576 | 449 | 888 | 1,454 | 781 |
| 2020's | 502 |
| - = No Data Reported; -- = Not Applicable; NA = Not Available; W = Withheld to avoid disclosure of individual company data. |
| Release Date: 2/9/2022 |
| Next Release Date: Suspended |