|
Download Data (XLS File) |
|
|||||
|
|||||
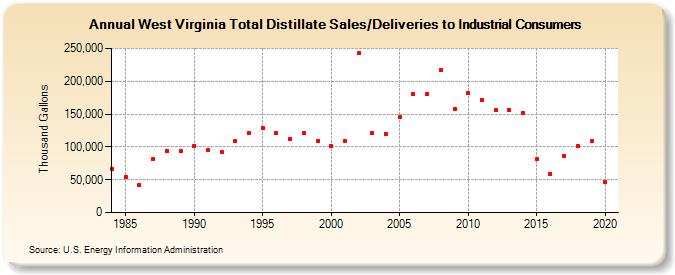
| West Virginia Total Distillate Sales/Deliveries to Industrial Consumers (Thousand Gallons) | |||||
| Decade | Year-0 | Year-1 | Year-2 | Year-3 | Year-4 | Year-5 | Year-6 | Year-7 | Year-8 | Year-9 |
|---|---|---|---|---|---|---|---|---|---|---|
| 1980's | 66,475 | 54,601 | 41,518 | 81,185 | 93,581 | 93,691 | ||||
| 1990's | 101,892 | 94,667 | 92,069 | 108,373 | 120,767 | 128,494 | 120,956 | 112,442 | 120,906 | 108,839 |
| 2000's | 101,784 | 109,029 | 242,990 | 120,934 | 120,184 | 145,938 | 179,846 | 180,188 | 217,322 | 158,103 |
| 2010's | 181,559 | 171,500 | 155,661 | 155,909 | 151,601 | 80,954 | 59,368 | 85,416 | 100,617 | 108,508 |
| 2020's | 47,029 |
| - = No Data Reported; -- = Not Applicable; NA = Not Available; W = Withheld to avoid disclosure of individual company data. |
| Release Date: 2/9/2022 |
| Next Release Date: Suspended |