|
Download Data (XLS File) |
|
|||||
|
|||||
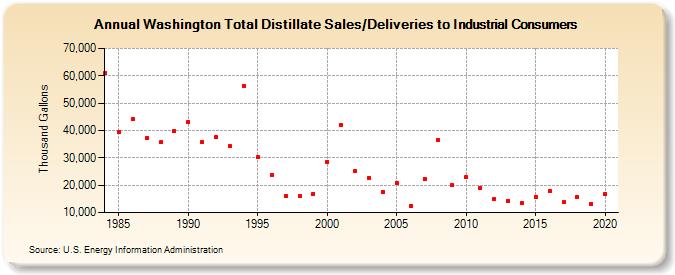
| Washington Total Distillate Sales/Deliveries to Industrial Consumers (Thousand Gallons) | |||||
| Decade | Year-0 | Year-1 | Year-2 | Year-3 | Year-4 | Year-5 | Year-6 | Year-7 | Year-8 | Year-9 |
|---|---|---|---|---|---|---|---|---|---|---|
| 1980's | 61,024 | 39,405 | 44,090 | 37,232 | 35,657 | 39,830 | ||||
| 1990's | 43,141 | 35,719 | 37,492 | 34,228 | 56,413 | 30,181 | 23,645 | 16,062 | 15,925 | 16,958 |
| 2000's | 28,630 | 42,054 | 25,310 | 22,656 | 17,656 | 20,826 | 12,521 | 22,392 | 36,583 | 20,139 |
| 2010's | 22,912 | 18,808 | 14,787 | 14,322 | 13,567 | 15,852 | 17,789 | 13,694 | 15,662 | 13,093 |
| 2020's | 16,858 |
| - = No Data Reported; -- = Not Applicable; NA = Not Available; W = Withheld to avoid disclosure of individual company data. |
| Release Date: 2/9/2022 |
| Next Release Date: Suspended |