|
Download Data (XLS File) |
|
|||||
|
|||||
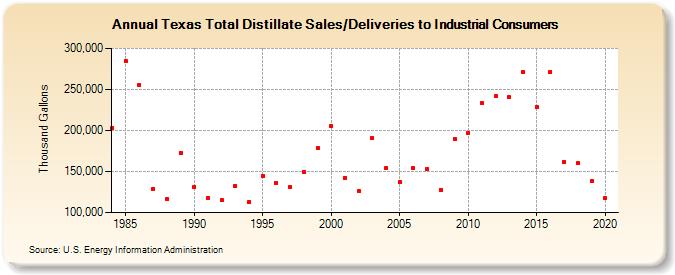
| Texas Total Distillate Sales/Deliveries to Industrial Consumers (Thousand Gallons) | |||||
| Decade | Year-0 | Year-1 | Year-2 | Year-3 | Year-4 | Year-5 | Year-6 | Year-7 | Year-8 | Year-9 |
|---|---|---|---|---|---|---|---|---|---|---|
| 1980's | 203,020 | 284,831 | 255,544 | 129,112 | 116,445 | 173,164 | ||||
| 1990's | 131,337 | 118,326 | 115,009 | 132,583 | 112,564 | 144,405 | 136,549 | 131,627 | 149,715 | 178,719 |
| 2000's | 205,301 | 142,467 | 125,677 | 190,629 | 154,383 | 137,046 | 153,950 | 153,228 | 128,019 | 189,981 |
| 2010's | 197,024 | 233,292 | 241,601 | 240,179 | 270,760 | 228,858 | 271,618 | 162,040 | 160,100 | 138,415 |
| 2020's | 117,178 |
| - = No Data Reported; -- = Not Applicable; NA = Not Available; W = Withheld to avoid disclosure of individual company data. |
| Release Date: 2/9/2022 |
| Next Release Date: Suspended |