|
Download Data (XLS File) |
|
|||||
|
|||||
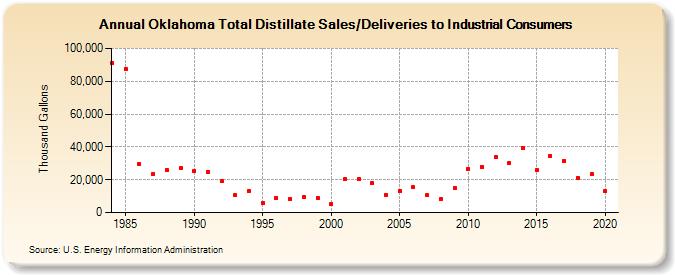
| Oklahoma Total Distillate Sales/Deliveries to Industrial Consumers (Thousand Gallons) | |||||
| Decade | Year-0 | Year-1 | Year-2 | Year-3 | Year-4 | Year-5 | Year-6 | Year-7 | Year-8 | Year-9 |
|---|---|---|---|---|---|---|---|---|---|---|
| 1980's | 90,869 | 87,713 | 29,540 | 23,638 | 25,807 | 26,845 | ||||
| 1990's | 25,297 | 24,889 | 19,151 | 10,656 | 13,048 | 5,773 | 9,080 | 8,345 | 9,384 | 9,084 |
| 2000's | 5,348 | 20,238 | 20,373 | 17,809 | 10,989 | 12,905 | 15,315 | 10,418 | 8,126 | 14,827 |
| 2010's | 26,632 | 27,954 | 33,544 | 30,234 | 39,110 | 25,844 | 34,584 | 31,661 | 21,264 | 23,309 |
| 2020's | 12,857 |
| - = No Data Reported; -- = Not Applicable; NA = Not Available; W = Withheld to avoid disclosure of individual company data. |
| Release Date: 2/9/2022 |
| Next Release Date: Suspended |