|
Download Data (XLS File) |
|
|||||
|
|||||
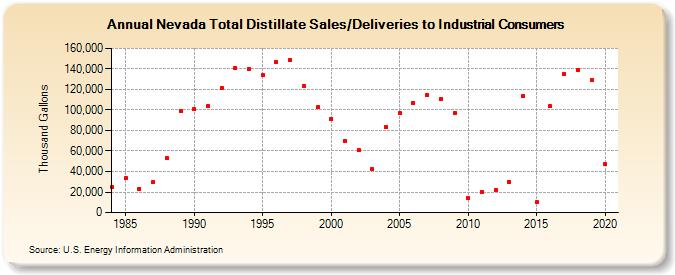
| Nevada Total Distillate Sales/Deliveries to Industrial Consumers (Thousand Gallons) | |||||
| Decade | Year-0 | Year-1 | Year-2 | Year-3 | Year-4 | Year-5 | Year-6 | Year-7 | Year-8 | Year-9 |
|---|---|---|---|---|---|---|---|---|---|---|
| 1980's | 24,528 | 33,630 | 23,288 | 29,543 | 53,150 | 99,407 | ||||
| 1990's | 100,605 | 103,802 | 121,422 | 140,479 | 140,084 | 133,688 | 146,846 | 148,472 | 123,545 | 102,804 |
| 2000's | 91,542 | 69,716 | 60,700 | 42,498 | 83,402 | 96,937 | 107,184 | 114,116 | 110,574 | 97,327 |
| 2010's | 14,130 | 20,466 | 21,618 | 29,721 | 113,226 | 10,030 | 103,465 | 135,144 | 138,850 | 129,005 |
| 2020's | 46,962 |
| - = No Data Reported; -- = Not Applicable; NA = Not Available; W = Withheld to avoid disclosure of individual company data. |
| Release Date: 2/9/2022 |
| Next Release Date: Suspended |