|
Download Data (XLS File) |
|
|||||
|
|||||
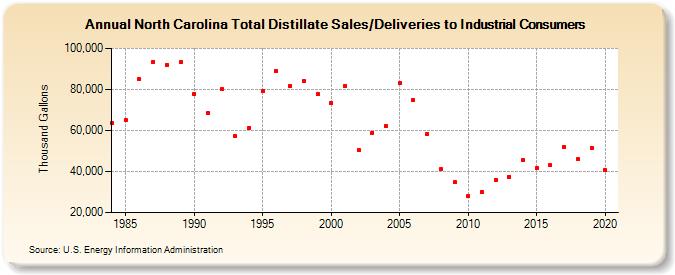
| North Carolina Total Distillate Sales/Deliveries to Industrial Consumers (Thousand Gallons) | |||||
| Decade | Year-0 | Year-1 | Year-2 | Year-3 | Year-4 | Year-5 | Year-6 | Year-7 | Year-8 | Year-9 |
|---|---|---|---|---|---|---|---|---|---|---|
| 1980's | 63,501 | 65,130 | 84,879 | 93,601 | 92,097 | 93,239 | ||||
| 1990's | 77,782 | 68,487 | 80,200 | 57,278 | 61,449 | 79,258 | 88,908 | 81,906 | 84,236 | 77,871 |
| 2000's | 73,290 | 81,738 | 50,440 | 59,001 | 62,064 | 82,935 | 74,757 | 58,358 | 41,103 | 34,723 |
| 2010's | 27,881 | 30,034 | 35,911 | 37,549 | 45,454 | 41,832 | 42,977 | 52,148 | 45,880 | 51,531 |
| 2020's | 40,668 |
| - = No Data Reported; -- = Not Applicable; NA = Not Available; W = Withheld to avoid disclosure of individual company data. |
| Release Date: 2/9/2022 |
| Next Release Date: Suspended |