|
Download Data (XLS File) |
|
|||||
|
|||||
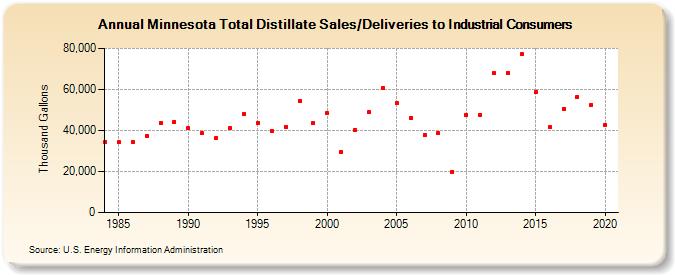
| Minnesota Total Distillate Sales/Deliveries to Industrial Consumers (Thousand Gallons) | |||||
| Decade | Year-0 | Year-1 | Year-2 | Year-3 | Year-4 | Year-5 | Year-6 | Year-7 | Year-8 | Year-9 |
|---|---|---|---|---|---|---|---|---|---|---|
| 1980's | 34,371 | 34,202 | 34,148 | 37,459 | 43,523 | 44,337 | ||||
| 1990's | 40,963 | 38,726 | 36,453 | 41,185 | 48,074 | 43,585 | 39,696 | 41,892 | 54,426 | 43,532 |
| 2000's | 48,399 | 29,511 | 40,378 | 48,803 | 60,808 | 53,247 | 46,047 | 37,853 | 38,702 | 19,926 |
| 2010's | 47,775 | 47,664 | 67,968 | 68,223 | 77,225 | 58,558 | 41,651 | 50,608 | 56,325 | 52,592 |
| 2020's | 42,885 |
| - = No Data Reported; -- = Not Applicable; NA = Not Available; W = Withheld to avoid disclosure of individual company data. |
| Release Date: 2/9/2022 |
| Next Release Date: Suspended |