|
Download Data (XLS File) |
|
|||||
|
|||||
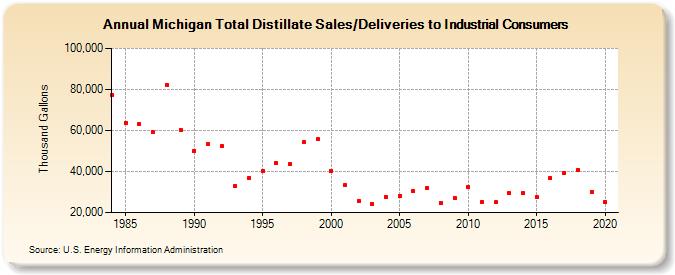
| Michigan Total Distillate Sales/Deliveries to Industrial Consumers (Thousand Gallons) | |||||
| Decade | Year-0 | Year-1 | Year-2 | Year-3 | Year-4 | Year-5 | Year-6 | Year-7 | Year-8 | Year-9 |
|---|---|---|---|---|---|---|---|---|---|---|
| 1980's | 77,183 | 63,775 | 63,152 | 59,125 | 82,164 | 60,339 | ||||
| 1990's | 50,226 | 53,275 | 52,358 | 32,892 | 36,926 | 40,418 | 44,156 | 43,633 | 54,239 | 55,707 |
| 2000's | 40,282 | 33,409 | 25,735 | 24,051 | 27,631 | 28,227 | 30,263 | 32,062 | 24,792 | 27,021 |
| 2010's | 32,477 | 25,347 | 24,959 | 29,402 | 29,427 | 27,418 | 36,900 | 39,510 | 40,795 | 30,193 |
| 2020's | 25,351 |
| - = No Data Reported; -- = Not Applicable; NA = Not Available; W = Withheld to avoid disclosure of individual company data. |
| Release Date: 2/9/2022 |
| Next Release Date: Suspended |