|
Download Data (XLS File) |
|
|||||
|
|||||
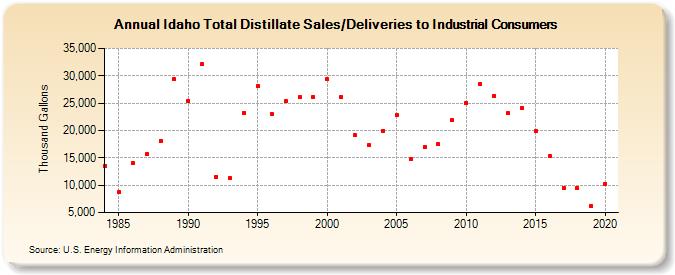
| Idaho Total Distillate Sales/Deliveries to Industrial Consumers (Thousand Gallons) | |||||
| Decade | Year-0 | Year-1 | Year-2 | Year-3 | Year-4 | Year-5 | Year-6 | Year-7 | Year-8 | Year-9 |
|---|---|---|---|---|---|---|---|---|---|---|
| 1980's | 13,529 | 8,747 | 14,087 | 15,620 | 18,079 | 29,332 | ||||
| 1990's | 25,386 | 32,062 | 11,565 | 11,283 | 23,256 | 28,126 | 23,027 | 25,330 | 26,149 | 26,150 |
| 2000's | 29,335 | 26,089 | 19,094 | 17,259 | 19,993 | 22,775 | 14,821 | 16,961 | 17,483 | 21,882 |
| 2010's | 25,074 | 28,487 | 26,389 | 23,147 | 24,193 | 19,858 | 15,286 | 9,501 | 9,468 | 6,163 |
| 2020's | 10,290 |
| - = No Data Reported; -- = Not Applicable; NA = Not Available; W = Withheld to avoid disclosure of individual company data. |
| Release Date: 2/9/2022 |
| Next Release Date: Suspended |